
Given $S =$ species richness,$A =$ area,$Z =$ slope of the line,and $C =$ $Y$-intercept. If area is on the $X$-axis and species richness is on the $Y$-axis,what will the graph of $\log S = \log C + Z \log A$ look like?
- A
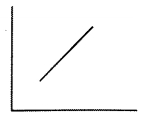
- B
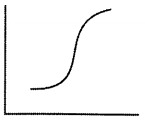
- C
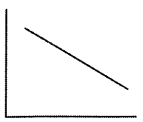
- D
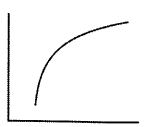
Explore More
Similar Questions
According to ecologists,what is the value of $Z$ in the species-area relationship equation $\log \, S = \log \, C + Z \, \log \, A$?
Medium
View SolutionSpecies diversity decreases as we move away from the equator towards the poles. What could be the possible reasons?
Easy
View SolutionAlexander von Humboldt explored which region for his research on species-area relationships?
Medium
View SolutionIdentify the correct statement.
Medium
View SolutionThe observation that "within a region, species richness increases with increasing exploratory area, but only up to a limit" was made by which scientist?
Medium
View SolutionVedclass Products
For Students
Vedclass Test Series
Mock tests in real JEE/NEET style with performance analysis. 5-day free trial.
Start Free TrialFor Teachers
Exam Paper Generator
Generate Set A/B/C/D exam papers from 7.5L+ questions in 2 minutes. 3 chapters free.
Try FreeFor Institutes
Online Exam Module
Live online exams with unlimited students, 360° analytics & white-label branding.
See Demo