
The temperature of a liquid in a beaker at time $t$ is $\theta(t)$ and the temperature of the surroundings is $\theta_0$. According to Newton's law of cooling,which of the following is the correct graph between $\log_e(\theta - \theta_0)$ and $t$?
- A
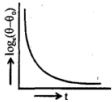
- B
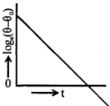
- C
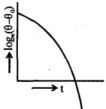
- D
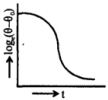
Explore More
Similar Questions
$A$ hollow copper sphere $S$ and a hollow copper cube $C$,both with negligible thin walls of the same surface area,are filled with water at $90^{\circ}C$ and allowed to cool in the same environment. The graph that correctly represents their cooling is:
Difficult
View SolutionTwo solid spheres of radii $R_1$ and $R_2$ are made of the same material and have similar surfaces. The spheres are raised to the same temperature and then allowed to cool under identical conditions. Assuming the spheres to be perfect conductors of heat,the ratio of their initial rates of cooling is:
If a body cools from a temperature of $62^{\circ} C$ to $50^{\circ} C$ in $10 \, \text{minutes}$ and to $42^{\circ} C$ in the next $10 \, \text{minutes}$, then the temperature of the surroundings is (in $^{\circ} C$)
Two spheres of radii $R_1$ and $R_2$ have densities $\rho_1$ and $\rho_2$ and specific heats $S_1$ and $S_2$. If they are heated to the same temperature,what is the ratio of their rates of cooling?
Medium
View SolutionConsider two hot bodies $B_1$ and $B_2$ which have temperatures $100^oC$ and $80^oC$ respectively at $t = 0$. The temperature of the surroundings is $40^oC$. The ratio of the respective rates of cooling $R_1$ and $R_2$ of these two bodies at $t = 0$ will be
Medium
View SolutionVedclass Products
For Students
Vedclass Test Series
Mock tests in real JEE/NEET style with performance analysis. 5-day free trial.
Start Free TrialFor Teachers
Exam Paper Generator
Generate Set A/B/C/D exam papers from 7.5L+ questions in 2 minutes. 3 chapters free.
Try FreeFor Institutes
Online Exam Module
Live online exams with unlimited students, 360° analytics & white-label branding.
See Demo