
For a thin spherical shell of radius $R$ with a uniform surface charge density, which of the following graphs best represents the variation of the electric field magnitude $|\vec{E}(r)|$ and the electric potential $V(r)$ with the distance $r$ from the center?
- A
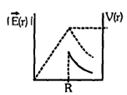
- B
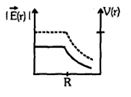
- C
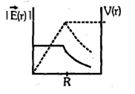
- D
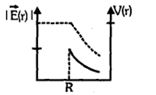
Explore More
Similar Questions
Six point charges are placed at the vertices of a regular hexagon of side $a$ as shown. If $E$ represents the electric field and $V$ represents the electric potential at the center $O$,then:
Medium
View Solution$A$ table tennis ball,which has been covered with conducting paint,is suspended by a silk thread so that it hangs between two plates. One plate is earthed,and the other is connected to a high-voltage generator. This ball:
Easy
View Solution$A$ particle of mass $m$ and charge $q$ is thrown in a region where uniform gravitational field and electric field are present. The path of the particle:
The dimension of $\frac{1}{2} \varepsilon_0 E^2$,where $\varepsilon_0$ is the permittivity of free space and $E$ is the electric field,is:
MediumAIPMT 2010
View SolutionWhich of the following is true for the figure showing electric lines of force? ($E$ is electrical field,$V$ is potential)
Medium
View SolutionVedclass Products
For Students
Vedclass Test Series
Mock tests in real JEE/NEET style with performance analysis. 5-day free trial.
Start Free TrialFor Teachers
Exam Paper Generator
Generate Set A/B/C/D exam papers from 7.5L+ questions in 2 minutes. 3 chapters free.
Try FreeFor Institutes
Online Exam Module
Live online exams with unlimited students, 360° analytics & white-label branding.
See Demo