
$A$ radioactive sample consists of two distinct species having an equal number of atoms initially. The mean life time of one species is $\tau$ and that of the other is $5 \tau$. The decay products in both cases are stable. $A$ plot is made of the total number of radioactive nuclei as a function of time. Which of the following figures best represents the form of this plot?
- A
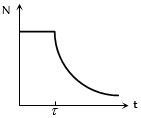
- B
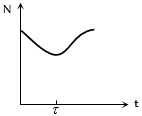
- C
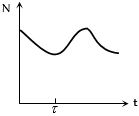
- D
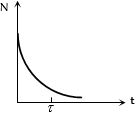
Explore More
Similar Questions
The activity of a radioactive sample is measured as $N_0$ counts per minute at $t = 0$ and $N_0/e$ counts per minute at $t = 5\, \text{minutes}$. The time (in minutes) at which the activity reduces to half of its initial value is
Difficult
View SolutionIf a radioactive material remains $25 \%$ after $16$ days,then its half-life will be ......... days.
Easy
View SolutionHalf-life of a radioactive substance is $20 \text{ min}$. The time between $20 \%$ and $80 \%$ decay will be: (in $\text{ min}$)
MediumWBJEE 2010
View SolutionTritium has a half-life of $12.5\; y$ undergoing beta decay. What fraction of a sample of pure tritium will remain undecayed after $25\; y$?
Easy
View SolutionFor a substance,the fraction of its initial quantity $(N_0)$ which will disintegrate in its average lifetime is about $(e = 2.71)$.
Vedclass Products
For Students
Vedclass Test Series
Mock tests in real JEE/NEET style with performance analysis. 5-day free trial.
Start Free TrialFor Teachers
Exam Paper Generator
Generate Set A/B/C/D exam papers from 7.5L+ questions in 2 minutes. 3 chapters free.
Try FreeFor Institutes
Online Exam Module
Live online exams with unlimited students, 360° analytics & white-label branding.
See Demo