
Easy
$A$ student plotted the following four graphs representing the variation of velocity of sound in a gas with the pressure $P$. Which one is correct?
- A
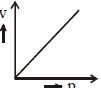
- B
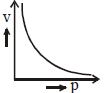
- C
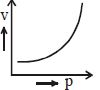
- D

Explore More
Similar Questions
When a tuning fork vibrates,the waves produced in the fork are
Easy
View SolutionThe speed of sound in air at temperature $T$ and pressure $p$ is $v$. When the temperature is increased to $2 T$ and the pressure is reduced to $\frac{p}{2}$, then the speed is changed to
$A$ person in front of a mountain is beating a drum at the rate of $40$ per minute and hears no distinct echo. If the person moves $90 \, m$ closer to the mountain,he has to beat the drum at $60$ per minute to not hear any distinct echo. The speed of sound is .............. $ms^{-1}$.
DifficultKVPY 2018
View SolutionWrite the equation for the speed of a sound wave according to Newton and explain the correction made by Laplace.
Difficult
View SolutionThe densities of two diatomic gases at constant temperature and pressure are $d_1$ and $d_2$. The ratio of the speed of sound in these gases is:
Easy
View SolutionVedclass Products
For Students
Vedclass Test Series
Mock tests in real JEE/NEET style with performance analysis. 5-day free trial.
Start Free TrialFor Teachers
Exam Paper Generator
Generate Set A/B/C/D exam papers from 7.5L+ questions in 2 minutes. 3 chapters free.
Try FreeFor Institutes
Online Exam Module
Live online exams with unlimited students, 360° analytics & white-label branding.
See Demo