
From the given graph of population growth,select the correct option that shows the correct value of '$r$' and the corresponding age pyramid.
- A
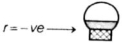
- B
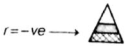
- C
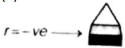
- D
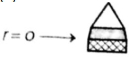
Explore More
Similar Questions
The exponential growth equation is $N_{t} = N_{0}e^{rt}$,where $N_{t}$ is the population density after time $t$. What do $N_{0}$ and $r$ refer to,respectively?
Given below are two statements:
Statement-$I$: $A$ population growing in a habitat with limited resources shows initially a lag phase.
Statement-$II$: $A$ population growing in a habitat with limited resources shows finally an asymptote phase.
Statement-$I$: $A$ population growing in a habitat with limited resources shows initially a lag phase.
Statement-$II$: $A$ population growing in a habitat with limited resources shows finally an asymptote phase.
Medium
View SolutionWhich one of the following is $INCORRECT$ about the logistic growth model?
In a population growth curve,which of the following equations represents the sigmoid growth curve?
Medium
View SolutionHuman population after the $17$th century $A.D.$ is thought to be in which phase?
Medium
View SolutionVedclass Products
For Students
Vedclass Test Series
Mock tests in real JEE/NEET style with performance analysis. 5-day free trial.
Start Free TrialFor Teachers
Exam Paper Generator
Generate Set A/B/C/D exam papers from 7.5L+ questions in 2 minutes. 3 chapters free.
Try FreeFor Institutes
Online Exam Module
Live online exams with unlimited students, 360° analytics & white-label branding.
See Demo