
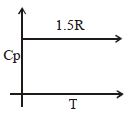
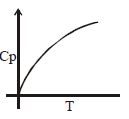
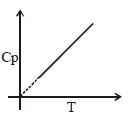
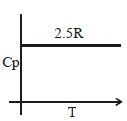
Which graph represents the relationship between heat capacity at constant pressure $(C_p)$ and temperature $(T)$ for a monatomic ideal gas?
- A
- B
- C
- D
Explore More
Similar Questions
Explain Heat Capacity.
Medium
View SolutionWhat will be the $\Delta U$ value, when one mole of oxygen $(O_2)$ is heated from $-20^{\circ} C$ to $40^{\circ} C$ at constant volume (in $J$)? (Molar heat capacity for oxygen $\simeq 20.8 \ J \ mol^{-1} \ K^{-1}$)
Fill in the blanks:
$(i)$ The unit of heat capacity is ......... .
$(ii)$ Heat capacity is a ......... property of matter.
$(iii)$ The amount of heat required to raise the temperature of $1 \ mol$ of a substance by $1^{\circ} C$ is called ......... .
$(i)$ The unit of heat capacity is ......... .
$(ii)$ Heat capacity is a ......... property of matter.
$(iii)$ The amount of heat required to raise the temperature of $1 \ mol$ of a substance by $1^{\circ} C$ is called ......... .
Medium
View SolutionWhat is the value of ${\left[ {\partial U/\partial T} \right]_V}$ for $He$ gas?
Medium
View Solution$A_{(g)} \to 2B_{(g)}$; $\Delta_rH = 20 \ kJ/mol$ at $300 \ K$. If $C_{p,m}(A) = 20 \ J \ K^{-1} \ mol^{-1}$ and $C_{p,m}(B) = 5 \ J \ K^{-1} \ mol^{-1}$,which of the following statements is correct?
Medium
View SolutionVedclass Products
For Students
Vedclass Test Series
Mock tests in real JEE/NEET style with performance analysis. 5-day free trial.
Start Free TrialFor Teachers
Exam Paper Generator
Generate Set A/B/C/D exam papers from 7.5L+ questions in 2 minutes. 3 chapters free.
Try FreeFor Institutes
Online Exam Module
Live online exams with unlimited students, 360° analytics & white-label branding.
See Demo