
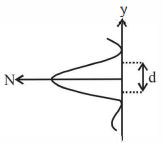
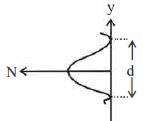
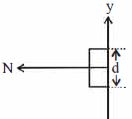
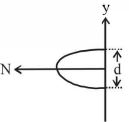
In an experiment, electrons are made to pass through a narrow slit of width '$d$' comparable to their de Broglie wavelength. They are detected on a screen at a distance '$D$' from the slit (see figure). Which of the following graphs can be expected to represent the number of electrons '$N$' detected as a function of the detector position '$y$' ($y = 0$ corresponds to the middle of the slit)?
- A
- B
- C
- D
Explore More
Similar Questions
In a single slit diffraction pattern, the distance between the first minimum on the left and the first minimum on the right is $5 \,mm$. The screen on which the diffraction pattern is obtained is at a distance of $80 \,cm$ from the slit. The wavelength used is $6000 \mathring{A}$. The width of the slit is (in $\,mm$)
In a single slit diffraction experiment, the first minimum for red light $(660 \ nm)$ coincides with the first secondary maximum of some other wavelength $\lambda$. The value of $\lambda$ is $..... \mathring{A}$.
Medium
View SolutionThe luminous border that surrounds the profile of a mountain just before the sun rises behind it is an example of:
$A$ narrow slit of width $2 \ mm$ is illuminated with a monochromatic light of wavelength $500 \ nm$. If the distance between the slit and the screen is $1 \ m$,then the first minima are separated by a distance of: (in $mm$)
In the far-field diffraction pattern of a single slit under polychromatic illumination,the first minimum with the wavelength ${\lambda _1}$ is found to be coincident with the third maximum at ${\lambda _2}$. So,
Medium
View SolutionVedclass Products
For Students
Vedclass Test Series
Mock tests in real JEE/NEET style with performance analysis. 5-day free trial.
Start Free TrialFor Teachers
Exam Paper Generator
Generate Set A/B/C/D exam papers from 7.5L+ questions in 2 minutes. 3 chapters free.
Try FreeFor Institutes
Online Exam Module
Live online exams with unlimited students, 360° analytics & white-label branding.
See Demo