
Medium
Liquid oxygen at $50\ K$ is heated to $300\ K$ at a constant pressure of $1\ atm$. The rate of heating is constant. Which of the following graphs represents the variation of temperature with time?
- A
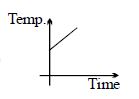
- B
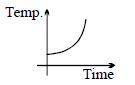
- C
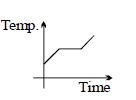
- D
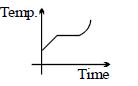
Explore More
Similar Questions
Match the following items in Column-$I$ with their corresponding definitions in Column-$II$.
Column-$I$ Column-$II$ $A$. Conversion of liquid into solid is $1$. Regelation $B$. Conversion of liquid into vapour is $2$. Sublimation $C$. Conversion of solid into vapour directly is $3$. Fusion $D$. Melting of ice caused by pressure is $4$. Vaporisation
| Column-$I$ | Column-$II$ |
| $A$. Conversion of liquid into solid is | $1$. Regelation |
| $B$. Conversion of liquid into vapour is | $2$. Sublimation |
| $C$. Conversion of solid into vapour directly is | $3$. Fusion |
| $D$. Melting of ice caused by pressure is | $4$. Vaporisation |
What is the process of changing the state of matter called?
Medium
View SolutionThe graph shown in the figure represents the change in the temperature of $5 \, kg$ of a substance as it absorbs heat at a constant rate of $42 \, kJ \, min^{-1}$. The latent heat of vaporization of the substance is ......... $kJ \, kg^{-1}$.
Medium
View Solution$A$ substance of mass $m \ kg$ requires a power input of $P \ W$ to remain in the molten state at its melting point. When the power is turned off,the sample completely solidifies in time $t \ s$. What is the latent heat of fusion of the substance?
MediumIIT 1992
View SolutionThe graph shows the variation of temperature $(T)$ of one kilogram of a material with the heat $(H)$ supplied to it. At $O$,the substance is in the solid state. From the graph,we can conclude that
Easy
View SolutionVedclass Products
For Students
Vedclass Test Series
Mock tests in real JEE/NEET style with performance analysis. 5-day free trial.
Start Free TrialFor Teachers
Exam Paper Generator
Generate Set A/B/C/D exam papers from 7.5L+ questions in 2 minutes. 3 chapters free.
Try FreeFor Institutes
Online Exam Module
Live online exams with unlimited students, 360° analytics & white-label branding.
See Demo