
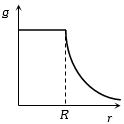
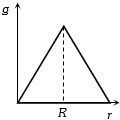
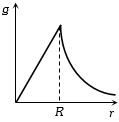
Assuming the density of the Earth is constant, which graph correctly represents the variation of acceleration due to gravity $(g)$ with the distance $(r)$ from the center of the Earth (radius of the Earth $= R$)?
- A
- B
- C
- DNone of these.
Explore More
Similar Questions
What will be the acceleration due to gravity at a height $h$ above the Earth's surface,where $R$ is the radius of the Earth and $g$ is the acceleration due to gravity on the surface of the Earth?
Easy
View SolutionThe height at which the acceleration due to gravity becomes $\frac{g}{9}$ (where $g$ = the acceleration due to gravity on the surface of the earth) in terms of $R$,the radius of the earth,is
MediumAIEEE 2009
View SolutionExplain the variations of acceleration due to gravity inside and outside the Earth and draw the graph.
Difficult
View SolutionIf the angular speed of the earth is doubled,the value of acceleration due to gravity $(g)$ at the north pole:
Easy
View SolutionConsider Earth to be a sphere of radius $R_e$ rotating about its own axis with angular speed $\omega$. If $g_{E}$ and $g_{P}$ are the accelerations due to gravity at the equator and the poles respectively,then $(g_{P}-g_{E})$ is given by $\left[\cos (0^{\circ})=\sin (\frac{\pi}{2})=1, \sin (0^{\circ})=\cos (\frac{\pi}{2})=0\right]$
Vedclass Products
For Students
Vedclass Test Series
Mock tests in real JEE/NEET style with performance analysis. 5-day free trial.
Start Free TrialFor Teachers
Exam Paper Generator
Generate Set A/B/C/D exam papers from 7.5L+ questions in 2 minutes. 3 chapters free.
Try FreeFor Institutes
Online Exam Module
Live online exams with unlimited students, 360° analytics & white-label branding.
See Demo