
The charge density $P$ in a nucleus varies with distance $r$ from the centre of the nucleus according to the curve in the figure. Which of the following graphs correctly represents this variation?
- A
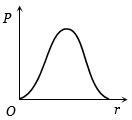
- B
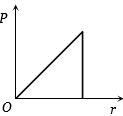
- C
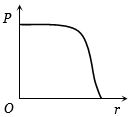
- D
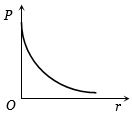
Explore More
Similar Questions
The value of the average density of a nucleus is $\qquad$ times that of water.
Assertion: Separation of isotopes is possible because of the difference in electron numbers of isotopes.
Reason: Isotopes of an element can be separated by using a mass spectrometer.
Reason: Isotopes of an element can be separated by using a mass spectrometer.
Show that the volume of a nucleus is proportional to its atomic mass number $A$.
Easy
View SolutionGiven the mass of an iron nucleus as $55.85 \, u$ and $A=56$,find the nuclear density.
Medium
View SolutionWhen a $U^{238}$ nucleus,initially at rest,decays by emitting an alpha particle with speed $u$,what will be the recoil velocity of the residual nucleus?
Difficult
View SolutionVedclass Products
For Students
Vedclass Test Series
Mock tests in real JEE/NEET style with performance analysis. 5-day free trial.
Start Free TrialFor Teachers
Exam Paper Generator
Generate Set A/B/C/D exam papers from 7.5L+ questions in 2 minutes. 3 chapters free.
Try FreeFor Institutes
Online Exam Module
Live online exams with unlimited students, 360° analytics & white-label branding.
See Demo