
The variation of current $(I)$ and voltage $(V)$ is as shown in figure $A$. The variation of power $P$ with current $I$ is best shown by which of the following graphs?
- A
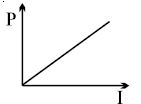
- B
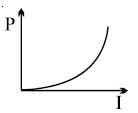
- C
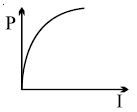
- D
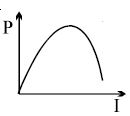
Explore More
Similar Questions
$A$ steel wire has a resistance twice that of an aluminium wire. Both of them are connected to a constant voltage supply. More heat will be dissipated in:
Easy
View SolutionFor the circuits shown in figures $I$ and $II$,the voltmeter reading would be
MediumAIIMS 2012
View Solution$A$ galvanometer $(G)$ of $2 \ \Omega$ resistance is connected in the given circuit. The ratio of charge in $C_1$ $(4 \ \mu F)$ and $C_2$ $(6 \ \mu F)$ is:
DifficultJEE MAIN 2024
View Solution$A$ wire of $20 \Omega$ is immersed in ice. If $10 \ A$ current is passed through this wire for $1 \ minute$,the ice completely melts. The mass of the ice is nearly $(L_{\text{ice}} = 79.7 \ cal \ g^{-1})$
What is the energy stored in the capacitor of the given circuit?
Difficult
View SolutionVedclass Products
For Students
Vedclass Test Series
Mock tests in real JEE/NEET style with performance analysis. 5-day free trial.
Start Free TrialFor Teachers
Exam Paper Generator
Generate Set A/B/C/D exam papers from 7.5L+ questions in 2 minutes. 3 chapters free.
Try FreeFor Institutes
Online Exam Module
Live online exams with unlimited students, 360° analytics & white-label branding.
See Demo