
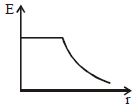
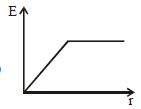
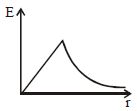
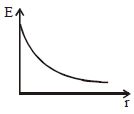
Which graph shows the variation of the electric field of a uniformly charged non-conducting sphere with respect to the distance $(r)$ from the centre?
- A
- B
- C
- D
Explore More
Similar Questions
$X$ and $Y$ are large,parallel conducting plates close to each other. Each face has an area $A$. $X$ is given a charge $Q$. $Y$ is without any charge. Points $A, B$,and $C$ are as shown in the figure.
The electric field inside a spherical shell of uniform surface charge density is
Easy
View SolutionThe electric field at a distance $\frac{3R}{2}$ from the centre of a charged conducting spherical shell of radius $R$ is $E.$ The electric field at a distance $\frac{R}{2}$ from the centre of the sphere is
At a distance $l$ from a uniformly charged long wire, a charged particle is thrown radially outward with a velocity $u$ in the direction perpendicular to the wire. When the particle reaches a distance $2l$ from the wire, its speed is found to be $\sqrt{2}u$. The magnitude of the velocity, when it is a distance $4l$ away from the wire is (ignore gravity)
An electric field converges at the origin whose magnitude is given by the expression $E = 100\,r\,N/C$,where $r$ is the distance measured from the origin.
Difficult
View SolutionVedclass Products
For Students
Vedclass Test Series
Mock tests in real JEE/NEET style with performance analysis. 5-day free trial.
Start Free TrialFor Teachers
Exam Paper Generator
Generate Set A/B/C/D exam papers from 7.5L+ questions in 2 minutes. 3 chapters free.
Try FreeFor Institutes
Online Exam Module
Live online exams with unlimited students, 360° analytics & white-label branding.
See Demo