
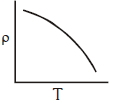
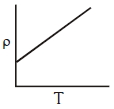
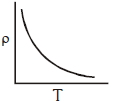
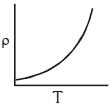
Which of the following graphs represents the variation of resistivity ( $\rho$ ) with temperature $(T)$ for copper?
- A
- B
- C
- D
Explore More
Similar Questions
Three copper wires of lengths and cross-sectional areas are $(l, A)$,$(2l, A/2)$,and $(l/2, 2A)$. Resistance is minimum in
$A$ tapered bar of length $L$ and end diameters $D_1$ and $D_2$ is made of a material of electrical resistivity $\rho$. The electrical resistance of the bar is
Two wires of equal length and equal diameter and having resistivities $\rho_1$ and $\rho_2$ are connected in series. The equivalent resistivity of the combination is . . . . . . .
The resistivity of alloys is $\rho_{\text{alloy}}$ and the resistivity of constituent metals is $\rho_{\text{metal}}$. Then,usually:
Easy
View Solution$A$ cylindrical wire $P$ has resistance $10 \ \Omega$. $A$ second wire $Q$ has length and diameter half that of $P$. If the material of both the wires is same,then the resistance of wire $Q$ is (in $\Omega$)
Vedclass Products
For Students
Vedclass Test Series
Mock tests in real JEE/NEET style with performance analysis. 5-day free trial.
Start Free TrialFor Teachers
Exam Paper Generator
Generate Set A/B/C/D exam papers from 7.5L+ questions in 2 minutes. 3 chapters free.
Try FreeFor Institutes
Online Exam Module
Live online exams with unlimited students, 360° analytics & white-label branding.
See Demo