
Which of the following graphs between pressure $(P)$ and volume $(V)$ of a gas correctly shows an isochoric process in thermodynamics?
- A
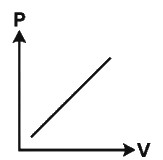
- B
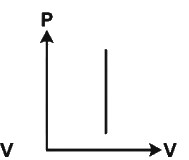
- C
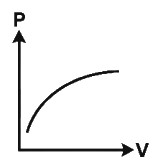
- D
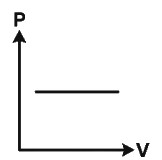
Explore More
Similar Questions
$A$ sample of gas expands from volume ${V_1}$ to ${V_2}$. The amount of work done by the gas is greatest when the expansion is
MediumAIIMS 1998
View SolutionAir is pumped into a balloon,of initial volume $V$,until its diameter has doubled. If the atmospheric pressure is $p$,what is the work done against the atmosphere?
Medium
View Solution$A$ diatomic gas with rigid molecules does $10 \ J$ of work when expanded at constant pressure. What would be the heat energy absorbed by the gas,in this process ..... $J$.
In an isochoric process,if $t_1 = 27^{\circ}C$ and $t_2 = 127^{\circ}C$,then $\frac{P_1}{P_2}$ will be equal to [$P_1$ and $P_2$ are the pressures at $t_1^{\circ}C$ and $t_2^{\circ}C$ respectively].
Find the heat energy required to increase the temperature of $2$ moles of a monoatomic gas from $273 \ K$ to $373 \ K$. (No work is done in the process.) (in $R$)
Medium
View SolutionVedclass Products
For Students
Vedclass Test Series
Mock tests in real JEE/NEET style with performance analysis. 5-day free trial.
Start Free TrialFor Teachers
Exam Paper Generator
Generate Set A/B/C/D exam papers from 7.5L+ questions in 2 minutes. 3 chapters free.
Try FreeFor Institutes
Online Exam Module
Live online exams with unlimited students, 360° analytics & white-label branding.
See Demo