
Class 11PhysicsKinetic Theory of GasesGas Laws (Charles, Boyle's, Avagadro's, Gay Lussacs and Dalton's law) and Ideal gas Equation
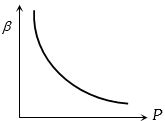
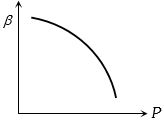
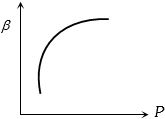
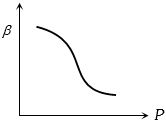
MediumWhich of the following graphs correctly represents the variation of $\beta = - (dV/dP)/V$ with $P$ for an ideal gas at constant temperature?
- A
- B
- C
- D
Explore More
Similar Questions
For a gas,as shown in the $P-T$ graph,the densities at points $A$ and $B$ are $\varrho_0$ and $\frac{4}{3} \varrho_0$ respectively. The value of $Y$ on the pressure $(P)$ axis is
$A$ given sample of an ideal gas occupies a volume $V$ at a pressure $P$ and absolute temperature $T.$ The mass of each molecule of the gas is $m.$ Which of the following gives the density of the gas $?$
MediumNEET 2016
View SolutionThe figure shows the volume $V$ versus temperature $T$ graphs for a certain mass of a perfect gas at two constant pressures of $P_1$ and $P_2$. What inference can you draw from the graphs?
MediumAIIMS 2014
View SolutionState and explain Dalton's law of partial pressure.
Medium
View SolutionThe pressure versus temperature graph of an ideal gas at constant volume $V$ and mass $m$ is shown by the straight line $A$. If the mass of the gas is doubled and the volume is halved,then the corresponding pressure versus temperature graph will be shown by the line:
Medium
View SolutionVedclass Products
For Students
Vedclass Test Series
Mock tests in real JEE/NEET style with performance analysis. 5-day free trial.
Start Free TrialFor Teachers
Exam Paper Generator
Generate Set A/B/C/D exam papers from 7.5L+ questions in 2 minutes. 3 chapters free.
Try FreeFor Institutes
Online Exam Module
Live online exams with unlimited students, 360° analytics & white-label branding.
See Demo