
Which of the following graphs represents the variation of power loss in the external load with external resistance $R$?
- A
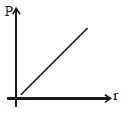
- B
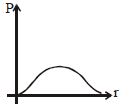
- C
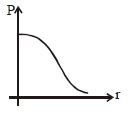
- D
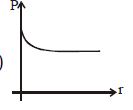
Explore More
Similar Questions
The rate of increase of thermo-e.m.f. with temperature at the neutral temperature of a thermocouple [$AIPMT$ $2011$]
Medium
View SolutionThe figure shows a network of five resistances and two batteries. The total electrical power consumed by the circuit is ............... $W$.
Difficult
View SolutionPick out the wrong statement.
Easy
View SolutionIn steady state, a capacitor of capacitance $2 \mu F$ is charged to $4 \mu C$, as shown in the figure. If the internal resistance of the cell is $0.5 \Omega$, then the emf of the cell is (in $\text{V}$)
When an electric heater is switched on, the current flowing through it $(I)$ is plotted against time $(t)$. Taking into account the variation of resistance with temperature, which of the following best represents the resulting curve?
Medium
View SolutionVedclass Products
For Students
Vedclass Test Series
Mock tests in real JEE/NEET style with performance analysis. 5-day free trial.
Start Free TrialFor Teachers
Exam Paper Generator
Generate Set A/B/C/D exam papers from 7.5L+ questions in 2 minutes. 3 chapters free.
Try FreeFor Institutes
Online Exam Module
Live online exams with unlimited students, 360° analytics & white-label branding.
See Demo