
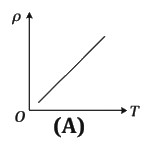
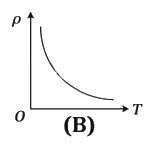
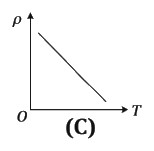
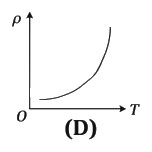
Which of the following graphs represents the temperature $(T)$ dependence of resistivity $(\rho)$ of a semiconductor?
- A
- B
- C
- D
Explore More
Similar Questions
The distance between the body-centered atom and a corner atom in sodium $(a = 4.225 \, \mathring{A})$ is ....... $\mathring{A}$ $[AIPMT \, 1995]$
Difficult
View SolutionFor non-conductors (insulators),the energy gap is: (in $, eV$)
Easy
View SolutionWhich of the following substances has an energy gap $(E_g)$ greater than $3 \ eV$?
At absolute zero,$Si$ acts as
Assertion $(A)$: When a wire of aluminium and another wire of silicon are heated from room temperature to $80^{\circ} C$,the conductivity of aluminium decreases and that of silicon increases.
Reason $(R)$: Aluminium has a positive temperature coefficient of resistivity and silicon has a negative temperature coefficient of resistivity.
Reason $(R)$: Aluminium has a positive temperature coefficient of resistivity and silicon has a negative temperature coefficient of resistivity.
Vedclass Products
For Students
Vedclass Test Series
Mock tests in real JEE/NEET style with performance analysis. 5-day free trial.
Start Free TrialFor Teachers
Exam Paper Generator
Generate Set A/B/C/D exam papers from 7.5L+ questions in 2 minutes. 3 chapters free.
Try FreeFor Institutes
Online Exam Module
Live online exams with unlimited students, 360° analytics & white-label branding.
See Demo