
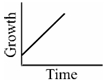
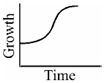
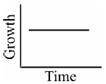
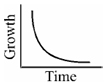
Which one is the correct graph for arithmetic growth?
- A
- B
- C
- D
Explore More
Similar Questions
Assertion $(A)$: Morphogenesis and differentiation occur during the process of growth.
Reason $(R)$: The number of cells increases during growth.
Reason $(R)$: The number of cells increases during growth.
Medium
View SolutionGrowth in plants is measured by the increase in
$I.$ Fresh weight. $II.$ Dry weight
$III.$ Length,area and volume $IV.$ Cell number
Choose the correct option.
$I.$ Fresh weight. $II.$ Dry weight
$III.$ Length,area and volume $IV.$ Cell number
Choose the correct option.
Medium
View Solution$A$ primary root grows from $5 \, cm$ to $19 \, cm$ in a week. Calculate the growth rate and relative growth rate over the period.
Medium
View SolutionIn the figure of the sigmoid growth curve given below,label segments $1$,$2$,and $3$.
Easy
View SolutionGiven below is a graph drawn on the parameters of growth versus time. $A, B$ and $C$ respectively represent
Medium
View SolutionVedclass Products
For Students
Vedclass Test Series
Mock tests in real JEE/NEET style with performance analysis. 5-day free trial.
Start Free TrialFor Teachers
Exam Paper Generator
Generate Set A/B/C/D exam papers from 7.5L+ questions in 2 minutes. 3 chapters free.
Try FreeFor Institutes
Online Exam Module
Live online exams with unlimited students, 360° analytics & white-label branding.
See Demo