
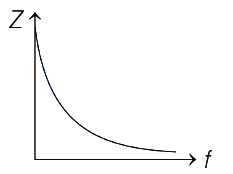
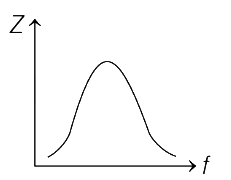
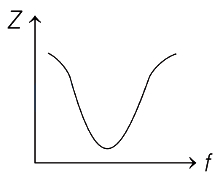
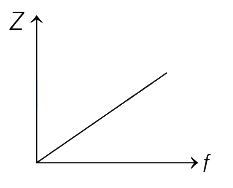
Which one of the following curves represents the variation of impedance $(Z)$ with frequency $(f)$ in a series $L-C-R$ circuit,when connected to an $AC$ source?
- A
- B
- C
- D
Explore More
Similar Questions
In a given series $LCR$ circuit,$R = 4\, \Omega, X_L = 5\, \Omega$ and $X_C = 8\, \Omega$. The current :-
Easy
View SolutionAlternating current is flowing in an $LR$ circuit with inductance $L$ and resistance $R$. The frequency of the source is $f = \omega / 2\pi$. Which of the following statements is correct?
Medium
View SolutionThe diagram shows a capacitor $C$ and a resistor $R$ connected in series to an $ac$ source. $V_1$ and $V_2$ are voltmeters and $A$ is an ammeter. Consider the following statements:
$I$. Readings in $A$ and $V_2$ are always in phase.
$II$. Reading in $V_1$ lags behind the reading in $V_2$ by $\frac{\pi}{2}$.
$III$. Readings in $A$ and $V_1$ are always in phase.
Which of these statements is/are correct?
$I$. Readings in $A$ and $V_2$ are always in phase.
$II$. Reading in $V_1$ lags behind the reading in $V_2$ by $\frac{\pi}{2}$.
$III$. Readings in $A$ and $V_1$ are always in phase.
Which of these statements is/are correct?
Medium
View SolutionIn the given circuit,the voltage across the inductor will be ..... $V$.
Medium
View Solution$A$ virtual current of $4 \, A$ and $50 \, Hz$ flows in an $AC$ circuit containing a coil. The power consumed in the coil is $240 \, W$. If the virtual voltage across the coil is $100 \, V$,its inductance will be:
Difficult
View SolutionVedclass Products
For Students
Vedclass Test Series
Mock tests in real JEE/NEET style with performance analysis. 5-day free trial.
Start Free TrialFor Teachers
Exam Paper Generator
Generate Set A/B/C/D exam papers from 7.5L+ questions in 2 minutes. 3 chapters free.
Try FreeFor Institutes
Online Exam Module
Live online exams with unlimited students, 360° analytics & white-label branding.
See Demo