
Which one of the following graphs correctly represents the variation of the gravitational field $(I)$ with the distance $(r)$ from the centre of a spherical shell of mass $M$ and radius $a$?
- A
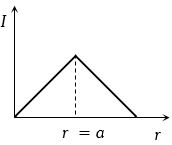
- B
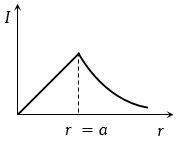
- C
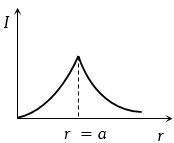
- D
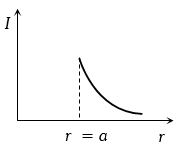
Explore More
Similar Questions
The mass density of a solid sphere is $\rho$. The radius of the sphere is $R$. The gravitational field at a distance $r$ from the centre of the sphere inside it is:
Medium
View SolutionThe gravitational potential versus distance $r$ graph is represented in the figure. The magnitude of the gravitational field intensity is equal to....... $N/kg$.
Medium
View SolutionGravitational potential in a region is given by $V = -(x + y + z) \text{ J/kg}$. Find the gravitational intensity at $(2, 2, 2)$ in $\text{N/kg}$.
Easy
View Solution$A$ body of mass $60 \, g$ experiences a gravitational force of $3.0 \, N$,when placed at a particular point. The magnitude of the gravitational field intensity at that point is ..... $N/kg$.
The gravitational field,due to the 'left over part' of a uniform sphere (from which a part as shown,has been 'removed out'),at a very far off point,$P$,located as shown,would be (nearly)
DifficultJEE MAIN 2013
View SolutionVedclass Products
For Students
Vedclass Test Series
Mock tests in real JEE/NEET style with performance analysis. 5-day free trial.
Start Free TrialFor Teachers
Exam Paper Generator
Generate Set A/B/C/D exam papers from 7.5L+ questions in 2 minutes. 3 chapters free.
Try FreeFor Institutes
Online Exam Module
Live online exams with unlimited students, 360° analytics & white-label branding.
See Demo