
Medium
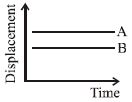
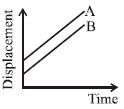
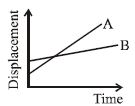
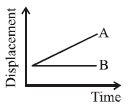
Which one of the following represents the displacement-time graph of two objects $A$ and $B$ moving with zero relative velocity?
- A
- B
- C
- D
Explore More
Similar Questions
$A$ particle shows a distance-time curve as shown in the figure. The maximum instantaneous velocity of the particle is around the point:
The velocity $v$ of a particle is given by the equation $v = 6t^2 - 6t^3$,where $v$ is in $m/s$ and $t$ is time in $s$. Then:
Medium
View SolutionTwo cars $P$ and $Q$ start from a point at the same time in a straight line and their positions are represented by $x_P(t) = at + bt^2$ and $x_Q(t) = ft - t^2$. At what time do the cars have the same velocity?
MediumNEET 2016
View Solution$A$ particle is moving along the $Y$-axis. The position of the particle from the origin as a function of time $(t)$ is given as $y(t) = 10 t e^{-2 t}$. How far is the particle from the origin when it stops momentarily? ($y$ is given in units of metre and $t$ is in units of second)
For the velocity-time graph shown in the figure,what fraction of the total distance covered in all seven seconds is the distance covered by the body in the last two seconds of its motion?
Medium
View SolutionVedclass Products
For Students
Vedclass Test Series
Mock tests in real JEE/NEET style with performance analysis. 5-day free trial.
Start Free TrialFor Teachers
Exam Paper Generator
Generate Set A/B/C/D exam papers from 7.5L+ questions in 2 minutes. 3 chapters free.
Try FreeFor Institutes
Online Exam Module
Live online exams with unlimited students, 360° analytics & white-label branding.
See Demo