
Which one of the following represents the graph between $\log p$ (on $Y$-axis) and $\frac{1}{T}$ (on $X$-axis)?
($p=$ vapour pressure of a liquid,$T=$ absolute temperature)
($p=$ vapour pressure of a liquid,$T=$ absolute temperature)
- A
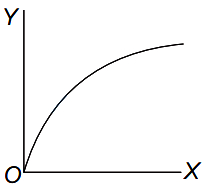
- B
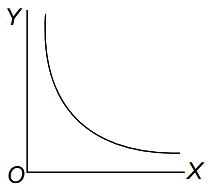
- C
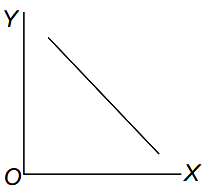
- D
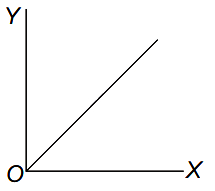
Explore More
Similar Questions
The number of gram atoms of oxygen present in $0.3 \, mole$ of $(COOH)_2 \cdot 2H_2O$ is
Which of the following compounds on oxidation gives methyl ethyl ketone?
The distribution of relative intensity $I(\lambda)$ of blackbody radiation from a solid object versus the wavelength $\lambda$ is shown in the figure. If the Wien displacement law constant is $2.9 \times 10^{-3} \ mK$,what is the approximate temperature of the object in $K$?
"Exobiology" refers to the study of
The sum of the last eight coefficients in the expansion of $(1 + x)^{15}$ is:
Vedclass Products
For Students
Vedclass Test Series
Mock tests in real JEE/NEET style with performance analysis. 5-day free trial.
Start Free TrialFor Teachers
Exam Paper Generator
Generate Set A/B/C/D exam papers from 7.5L+ questions in 2 minutes. 3 chapters free.
Try FreeFor Institutes
Online Exam Module
Live online exams with unlimited students, 360° analytics & white-label branding.
See Demo