
Which one of the following represents the graph between $\log p$ (on $Y$-axis) and $\frac{1}{T}$ (on $X$-axis)?
($p=$ vapour pressure of a liquid, $T=$ absolute temperature)
($p=$ vapour pressure of a liquid, $T=$ absolute temperature)
- A
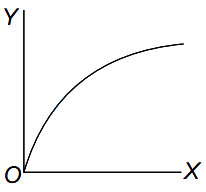
- B
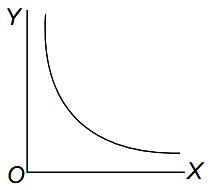
- C
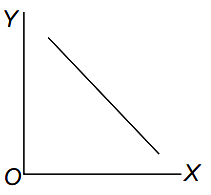
- D
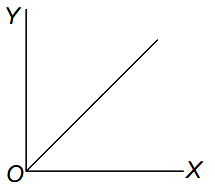
Explore More
Similar Questions
If two substances $A$ and $B$ have $P_A^0 : P_B^0 = 1 : 2$ and have mole fraction in solution $1 : 2$,then what is the mole fraction of $A$ in the vapour phase?
Medium
View Solution$A$ solution contains $KCl$ in water. It is heated continuously and the vapour formed is removed continuously. The vapour pressure of the solution will be:
Easy
View SolutionAt a given temperature,the vapour pressure of pure water is $25 \ mm$ and the vapour pressure of a dilute solution of urea is $24.5 \ mm$. The molality of the solution is:
Medium
View SolutionTwo liquids $X$ and $Y$ form an ideal solution. At a constant temperature of $300 \ K$,the vapor pressure of a solution containing $1 \ mol$ of $X$ and $3 \ mol$ of $Y$ is $550 \ mm \ Hg$. If $1 \ mol$ of $Y$ is added to this solution,the vapor pressure of the solution increases by $10 \ mm \ Hg$. What are the vapor pressures of $X$ and $Y$ in their pure states?
Difficult
View SolutionCalculate the relative lowering of vapour pressure of a solution containing $46 \ g$ of non-volatile solute in $162 \ g$ of water at $20^{\circ} C$. [Molar mass of non-volatile solute $= 46 \ g \ mol^{-1}$]
Vedclass Products
For Students
Vedclass Test Series
Mock tests in real JEE/NEET style with performance analysis. 5-day free trial.
Start Free TrialFor Teachers
Exam Paper Generator
Generate Set A/B/C/D exam papers from 7.5L+ questions in 2 minutes. 3 chapters free.
Try FreeFor Institutes
Online Exam Module
Live online exams with unlimited students, 360° analytics & white-label branding.
See Demo