
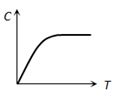
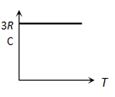
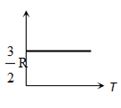
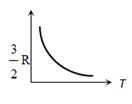
Which graph represents the molar heat capacity at constant volume $(C_V)$ for a monoatomic gas?
- A
- B
- C
- D
Explore More
Similar Questions
The difference between volume and pressure coefficients of an ideal gas is
The plot that depicts the behavior of the mean free time $t$ (time between two successive collisions) for the molecules of an ideal gas,as a function of temperature $(T)$,qualitatively,is (Graphs are schematic and not drawn to scale)
The oxygen molecule has a mass of $5.30 \times 10^{-26} \; kg$ and a moment of inertia of $1.94 \times 10^{-46} \; kg \cdot m^{2}$ about an axis through its centre perpendicular to the line joining the two atoms. Suppose the mean speed of such a molecule in a gas is $500 \; m/s$ and that its kinetic energy of rotation is two-thirds of its kinetic energy of translation. Find the average angular velocity of the molecule.
Medium
View SolutionFill in the blanks:
$(i)$ At absolute zero,the volume of an ideal gas is ...... .
$(ii)$ With an increase in temperature,the pressure of a gas ...... .
$(iii)$ All molecular motion will stop at ...... .
$(iv)$ Due to ...... at higher altitudes from the surface of the Earth,the air becomes cooler.
$(i)$ At absolute zero,the volume of an ideal gas is ...... .
$(ii)$ With an increase in temperature,the pressure of a gas ...... .
$(iii)$ All molecular motion will stop at ...... .
$(iv)$ Due to ...... at higher altitudes from the surface of the Earth,the air becomes cooler.
Medium
View SolutionFor an ideal gas at a temperature of $27^{\circ} C$ and at constant pressure, the coefficient of volume expansion is nearly
Vedclass Products
For Students
Vedclass Test Series
Mock tests in real JEE/NEET style with performance analysis. 5-day free trial.
Start Free TrialFor Teachers
Exam Paper Generator
Generate Set A/B/C/D exam papers from 7.5L+ questions in 2 minutes. 3 chapters free.
Try FreeFor Institutes
Online Exam Module
Live online exams with unlimited students, 360° analytics & white-label branding.
See Demo