
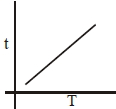
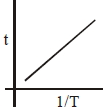
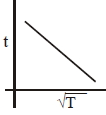
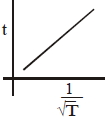
The plot that depicts the behavior of the mean free time $t$ (time between two successive collisions) for the molecules of an ideal gas,as a function of temperature $(T)$,qualitatively,is (Graphs are schematic and not drawn to scale)
- A
- B
- C
- D
Explore More
Similar Questions
An ideal gas filled in a cylinder occupies volume $V$. The gas is compressed isothermally to the volume $V/3$. Now,the cylinder valve is opened and the gas is allowed to leak keeping temperature same. What percentage of the number of molecules should escape to bring the pressure in the cylinder back to its original value (in $\%$)?
DifficultKVPY 2013
View SolutionOne mole of the ideal gas goes through the process $p=p_0\left[1-\alpha\left(\frac{V}{V_0}\right)^3\right]$, where $p$ and $V$ are pressure and volume, $p_0, V_0$ and $\alpha$ are constants. If the maximum attainable temperature of the gas is $\left(\frac{3}{4}\right) \frac{p_0 V_0}{R}$, then the value of $\alpha$ is
DifficultTS EAMCET 2018
View SolutionWhich of the following statements is true?
From the following $V-T$ diagram,we can conclude that:
Easy
View Solution$A$ fixed mass of gas at constant pressure occupies a volume $V$. The gas undergoes a rise in temperature so that the r.m.s. velocity of the molecules is doubled. The new volume will be
Vedclass Products
For Students
Vedclass Test Series
Mock tests in real JEE/NEET style with performance analysis. 5-day free trial.
Start Free TrialFor Teachers
Exam Paper Generator
Generate Set A/B/C/D exam papers from 7.5L+ questions in 2 minutes. 3 chapters free.
Try FreeFor Institutes
Online Exam Module
Live online exams with unlimited students, 360° analytics & white-label branding.
See Demo