
The variation of current flowing through an electric heater with time,when it is switched on,is shown in the figure. Considering the change in resistance with temperature,which of the following graphs is correct?
- A
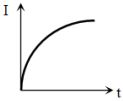
- B
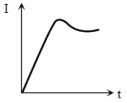
- C
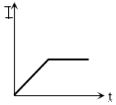
- D
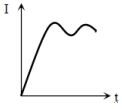
Explore More
Similar Questions
In a copper voltameter,the mass deposited in $6 \text{ min}$ is $m \text{ g}$. If the current-time graph for the voltameter is as shown in the figure,then the $E.C.E.$ of the copper is:
Difficult
View SolutionIn the circuit shown here,$E_1 = E_2 = E_3 = 2 \, V$ and $R_1 = R_2 = 4 \, \Omega$. The current flowing between points $A$ and $B$ through battery $E_2$ is
Medium
View SolutionIn the Seebeck series,$Sb$ appears before $Bi$. In an $Sb-Bi$ thermocouple,the current flows from:
Medium
View Solution$A$ uniform metallic wire of length $L$ is mounted in two configurations. In configuration $1$ (triangle),it is an equilateral triangle and a voltage $V$ is applied to corners $A$ and $B$. In configuration $2$ (circle),it is bent in the form of a circle and the potential $V$ is applied at diametrically opposite points $P$ and $Q$. The ratio of the power dissipated in configuration $1$ to configuration $2$ is
Which one of the following is not a correct statement?
Easy
View SolutionVedclass Products
For Students
Vedclass Test Series
Mock tests in real JEE/NEET style with performance analysis. 5-day free trial.
Start Free TrialFor Teachers
Exam Paper Generator
Generate Set A/B/C/D exam papers from 7.5L+ questions in 2 minutes. 3 chapters free.
Try FreeFor Institutes
Online Exam Module
Live online exams with unlimited students, 360° analytics & white-label branding.
See Demo