
Medium
$A$ particle released from rest is falling through a thick fluid under gravity. The fluid exerts a resistive force on the particle proportional to the square of its speed. Which one of the following graphs best depicts the variation of its speed $v$ with time $t$ ?
- A
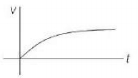
- B
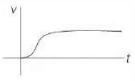
- C
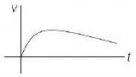
- D
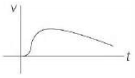
Explore More
Similar Questions
An air bubble of radius $r$ rises steadily through a liquid of density $\rho$ with velocity $v$. The coefficient of viscosity of the liquid is:
Easy
View SolutionAn object falling through a fluid is observed to have acceleration given by $a = g - bv$,where $g$ is the gravitational acceleration and $b$ is a constant. After a long time of release,it is observed to fall with a constant speed. What must be the value of this constant speed?
Difficult
View Solution$A$ spherical object is falling under gravity through a viscous fluid. The sphere attains the terminal velocity when
$A$ spherical liquid drop of radius $r$ acquires the terminal velocity $v_1$ when falling through a gas of viscosity $\eta$. Now the drop is broken into $64$ identical droplets and each droplet acquires terminal velocity $v_2$ falling through the same gas. The ratio of terminal velocities $v_1/v_2$ is . . . . . . .
DifficultJEE MAIN 2026
View SolutionTwo spherical rain drops reach the surface of the earth with terminal velocities having ratio $16: 9$. The ratio of their surface area is
Vedclass Products
For Students
Vedclass Test Series
Mock tests in real JEE/NEET style with performance analysis. 5-day free trial.
Start Free TrialFor Teachers
Exam Paper Generator
Generate Set A/B/C/D exam papers from 7.5L+ questions in 2 minutes. 3 chapters free.
Try FreeFor Institutes
Online Exam Module
Live online exams with unlimited students, 360° analytics & white-label branding.
See Demo