
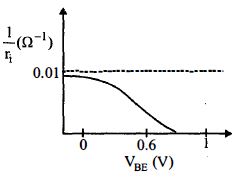
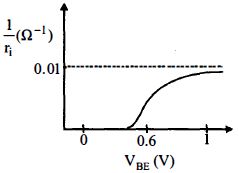
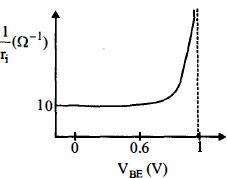
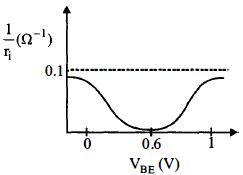
$A$ realistic graph depicting the variation of the reciprocal of input resistance $(1/r_i)$ in an input characteristics measurement in a common emitter transistor configuration is:
- A
- B
- C
- D
Explore More
Similar Questions
The depletion layer in $p-n$ junction region is caused by
In the given figure,which of the diodes are forward biased?
Medium
View SolutionThe circuit contains two diodes,each with a forward resistance of $50\, \Omega$ and an infinite reverse resistance. If the battery voltage is $6\, V$,the current through the $120\, \Omega$ resistance is $mA$.
DifficultJEE MAIN 2021
View SolutionWhich one of the following graphs represents the forward bias characteristic of a diode?
DifficultMHT CET 2022
View SolutionIn the following circuit,$PN$-junction diodes $D_1$,$D_2$,and $D_3$ are ideal. For the following potentials of $A$ and $B$,the correct increasing order of equivalent resistance between $A$ and $B$ will be:
$(i) V_A = -10 V, V_B = -5 V$
$(ii) V_A = -5 V, V_B = -10 V$
$(iii) V_A = -4 V, V_B = -12 V$
$(i) V_A = -10 V, V_B = -5 V$
$(ii) V_A = -5 V, V_B = -10 V$
$(iii) V_A = -4 V, V_B = -12 V$
Difficult
View SolutionVedclass Products
For Students
Vedclass Test Series
Mock tests in real JEE/NEET style with performance analysis. 5-day free trial.
Start Free TrialFor Teachers
Exam Paper Generator
Generate Set A/B/C/D exam papers from 7.5L+ questions in 2 minutes. 3 chapters free.
Try FreeFor Institutes
Online Exam Module
Live online exams with unlimited students, 360° analytics & white-label branding.
See Demo