
Class 11Physics10-1.Thermometry, Thermal Expansion and CalorimetryHeat Capacity, Specific Heat and Molar Specific Heat
DifficultAt temperatures close to $0\ K$, the heat capacity $C$ of a certain solid is related to its temperature $T$ by the equation $C = aT^3$, where $a$ is a constant characteristic of the solid. Heat is supplied to the solid at a steady rate. Which graph best represents the variation of its temperature $T$ with time $t$?
- A
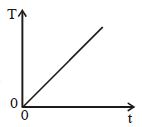
- B
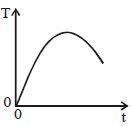
- C
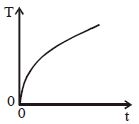
- D
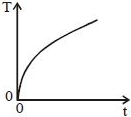
Explore More
Similar Questions
The heat energy released by water of mass $2 \,kg$ when it is cooled by $10^{\circ} C$ is (Specific heat capacity of water $= 4200 \,J \,kg^{-1} \,K^{-1}$) (in $\,J$)
What is the value of the specific heat of a solid by using the law of equipartition of energy?
Medium
View SolutionHeat energy at a constant rate is supplied to two substances $P$ and $Q$. If the variation of temperature $(T)$ of the substances with time $(t)$ is as shown in the figure,then select the correct statement.
Easy
View Solution$A$ lead bullet of mass $10 \ g$ travelling at $300 \ m/s$ strikes against a block of wood and comes to rest. Assuming $50\%$ of heat is absorbed by the bullet, the increase in its temperature is (Specific heat of lead $= 150 \ J/kg \cdot ^{\circ}C$) (in $^{\circ}C$)
DifficultTS EAMCET 2001
View SolutionIf some heat is given to a metal of mass $100 \ g$,its temperature rises by $20^{\circ} C$. If the same heat is given to $20 \ g$ of water,the change in its temperature (in $^{\circ} C$) is (The ratio of specific heat capacities of metal and water is $1: 10$).
Vedclass Products
For Students
Vedclass Test Series
Mock tests in real JEE/NEET style with performance analysis. 5-day free trial.
Start Free TrialFor Teachers
Exam Paper Generator
Generate Set A/B/C/D exam papers from 7.5L+ questions in 2 minutes. 3 chapters free.
Try FreeFor Institutes
Online Exam Module
Live online exams with unlimited students, 360° analytics & white-label branding.
See Demo