
Consider a thin spherical shell of radius $R$ with its centre at the origin,carrying uniform positive surface charge density. The variation of the magnitude of the electric field $|\vec{E}(r)|$ and the electric potential $V(r)$ with the distance $r$ from the centre,is best represented by which graph?
- A
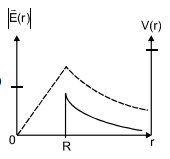
- B
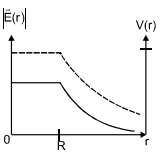
- C
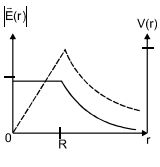
- D
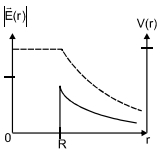
Explore More
Similar Questions
Three infinite plane sheets carrying uniform charge densities $-\sigma, 2 \sigma, 4 \sigma$ are placed parallel to the $XZ$ plane at $Y=a, 3a, 4a$ respectively. The electric field at the point $(0, 2a, 0)$ is
Two infinite plane parallel sheets separated by a distance $d$ have equal and opposite uniform charge densities $\sigma$ and $-\sigma$. The electric field at a point between the sheets is
Easy
View SolutionLet $\sigma$ be the uniform surface charge density of two infinite thin plane sheets shown in the figure. Then the electric fields in three different regions $I, II$ and $III$ are:
The given figure shows two parallel plates $A$ and $B$ with charge densities $+\sigma$ and $-\sigma$ respectively. The electric intensity will be zero in which region?
Easy
View SolutionAn infinitely long positively charged straight thread has a linear charge density $\lambda \text{ Cm}^{-1}$. An electron revolves along a circular path having its axis along the length of the wire. The graph that correctly represents the variation of the kinetic energy of the electron as a function of the radius $r$ of the circular path from the wire is:
DifficultJEE MAIN 2024
View SolutionVedclass Products
For Students
Vedclass Test Series
Mock tests in real JEE/NEET style with performance analysis. 5-day free trial.
Start Free TrialFor Teachers
Exam Paper Generator
Generate Set A/B/C/D exam papers from 7.5L+ questions in 2 minutes. 3 chapters free.
Try FreeFor Institutes
Online Exam Module
Live online exams with unlimited students, 360° analytics & white-label branding.
See Demo