
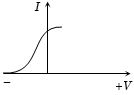
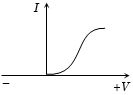
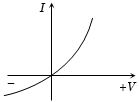
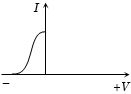
Different voltages are applied across a $P-N$ junction and the currents are measured for each value. Which of the following graphs is obtained between voltage and current?
- A
- B
- C
- D
Explore More
Similar Questions
For the diode,the characteristic curves are given at different temperatures. The relation between the temperatures is
Medium
View SolutionConsider the following circuit. The waveform given in input is as shown. If ${V_{B_1}}$ and ${V_{B_2}}$ are less than the peak value of the input,then the output will look like:
Difficult
View Solution$A$ waveform is applied to the following circuit. Assuming an ideal diode configuration and $R_1 = R_2$, which of the following output waveforms will be produced?
Difficult
View SolutionThe dominant mechanisms for motion of charge carriers in forward and reverse biased silicon $P-N$ junctions are
In which figure,the junction diode is forward biased?
Vedclass Products
For Students
Vedclass Test Series
Mock tests in real JEE/NEET style with performance analysis. 5-day free trial.
Start Free TrialFor Teachers
Exam Paper Generator
Generate Set A/B/C/D exam papers from 7.5L+ questions in 2 minutes. 3 chapters free.
Try FreeFor Institutes
Online Exam Module
Live online exams with unlimited students, 360° analytics & white-label branding.
See Demo