
For a simple pendulum,a graph is plotted between its kinetic energy $(KE)$ and potential energy $(PE)$ against its displacement $d$. Which one of the following represents these correctly? (graphs are schematic and not drawn to scale)
- A
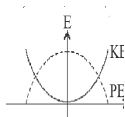
- B
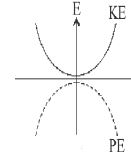
- C
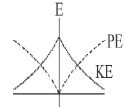
- D
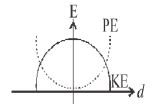
Explore More
Similar Questions
An object of mass $3 \,kg$ is executing simple harmonic motion with an amplitude $\frac{2}{\pi} \,m$. If the kinetic energy of the object when it crosses the mean position is $6 \,J$, the time period of oscillation of the object is (in $\,s$)
At which point (place) does a particle executing $SHM$ have maximum kinetic energy and maximum potential energy?
Easy
View SolutionFor a particle executing simple harmonic motion,the kinetic energy $K$ is given by $K = K_0 \cos^2 \omega t$. The maximum value of potential energy is
Easy
View SolutionThe potential energy of a simple harmonic oscillator at the mean position is $2\,J$. If its mean kinetic energy $(K.E.)$ is $4\,J$,its total energy will be .... $J$
Medium
View Solution$A$ linear harmonic oscillator of force constant $6 \times 10^5 \, N/m$ and amplitude $4 \, cm$ has a total energy of $600 \, J$. Select the correct statement.
Difficult
View SolutionVedclass Products
For Students
Vedclass Test Series
Mock tests in real JEE/NEET style with performance analysis. 5-day free trial.
Start Free TrialFor Teachers
Exam Paper Generator
Generate Set A/B/C/D exam papers from 7.5L+ questions in 2 minutes. 3 chapters free.
Try FreeFor Institutes
Online Exam Module
Live online exams with unlimited students, 360° analytics & white-label branding.
See Demo