
The current flowing through an inductor of self-inductance $L$ is continuously increasing at a constant rate. The variation of induced e.m.f. $(e)$ versus $dI/dt$ is shown graphically by which figure?
- A
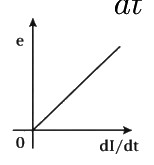
- B
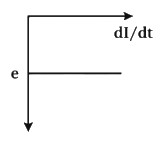
- C
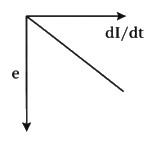
- D
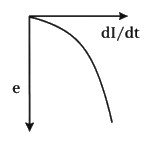
Explore More
Similar Questions
This question has Statement $1$ and Statement $2.$ Of the four choices given after the Statements,choose the one that best describes the two Statements.
Statement $1 :$ Self inductance of a long solenoid of length $L,$ total number of turns $N$ and radius $r$ is less than $\frac{{\pi {\mu _0}{N^2}{r^2}}}{L}$
Statement $2:$ The magnetic induction in the solenoid in Statement $1$ carrying current $I$ is $\frac{{{\mu _0}NI}}{L}$ in the middle of the solenoid but becomes less as we move towards its ends.
Statement $1 :$ Self inductance of a long solenoid of length $L,$ total number of turns $N$ and radius $r$ is less than $\frac{{\pi {\mu _0}{N^2}{r^2}}}{L}$
Statement $2:$ The magnetic induction in the solenoid in Statement $1$ carrying current $I$ is $\frac{{{\mu _0}NI}}{L}$ in the middle of the solenoid but becomes less as we move towards its ends.
MediumAIEEE 2012
View SolutionIn a circuit,the current falls from $14 \ A$ to $4 \ A$ in a time $0.2 \ ms$. If the induced emf is $150 \ V$,then the self-inductance of the circuit is:
The ratio of the number of turns per unit length of two solenoids $A$ and $B$ is $1: 3$ and the lengths of $A$ and $B$ are in the ratio $1: 2$. If the two solenoids have the same cross-sectional area,the ratio of the self-inductances of the solenoids $A$ and $B$ is
The inductance of a solenoid $0.5 \, m$ long of cross-sectional area $20 \, cm^2$ and with $500$ turns is......$mH$
Easy
View SolutionPhysically,the self-inductance plays the role of
Vedclass Products
For Students
Vedclass Test Series
Mock tests in real JEE/NEET style with performance analysis. 5-day free trial.
Start Free TrialFor Teachers
Exam Paper Generator
Generate Set A/B/C/D exam papers from 7.5L+ questions in 2 minutes. 3 chapters free.
Try FreeFor Institutes
Online Exam Module
Live online exams with unlimited students, 360° analytics & white-label branding.
See Demo