
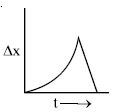
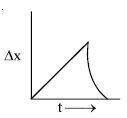
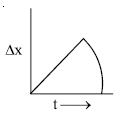
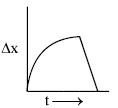
Two stones are thrown up vertically and simultaneously but with different speeds. Which graph correctly represents the time variation of their relative position $\Delta x$? Assume that stones do not bounce after hitting the ground.
- A
- B
- C
- D
Explore More
Similar Questions
During the first $18\,min$ of a $60\,min$ trip,a car has an average speed of $11\,m/s$. What should be the average speed for the remaining $42\,min$ so that the car has an average speed of $21\,m/s$ for the entire trip (in $,m/s$)?
Easy
View Solution$A$ car moves in the positive $Y$-direction with velocity $v$ proportional to the distance travelled $y$ as $v(y) \propto y^\beta$, where $\beta$ is a positive constant. The car covers a distance $L$ with average velocity $\langle v \rangle$ proportional to $L$ as $\langle v \rangle \propto L^{1/3}$. The constant $\beta$ is given as:
Look at the graphs $(a)$ to $(d)$ carefully and state,with reasons,which of these cannot possibly represent one-dimensional motion of a particle.
Medium
View Solution$A$ particle moving along a straight line covers the first half of the distance with a speed of $3 \, m \, s^{-1}$. The other half of the distance is covered in two equal time intervals with speeds of $4.5 \, m \, s^{-1}$ and $7.5 \, m \, s^{-1}$ respectively. The average speed of the particle during the motion is:
$A$ particle moves along the straight line $y=3x+5$. Which coordinate changes at a faster rate?
Medium
View SolutionVedclass Products
For Students
Vedclass Test Series
Mock tests in real JEE/NEET style with performance analysis. 5-day free trial.
Start Free TrialFor Teachers
Exam Paper Generator
Generate Set A/B/C/D exam papers from 7.5L+ questions in 2 minutes. 3 chapters free.
Try FreeFor Institutes
Online Exam Module
Live online exams with unlimited students, 360° analytics & white-label branding.
See Demo