
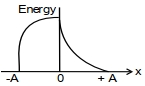
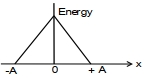
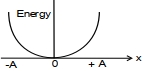
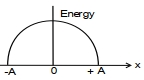
Which graph represents the difference between total energy and potential energy of a particle executing $SHM$ versus its distance from the mean position?
- A
- B
- C
- D
Explore More
Similar Questions
$A$ particle is executing linear simple harmonic motion of amplitude $A$. At what displacement is the energy of the particle half potential and half kinetic?
$A$ particle executes simple harmonic motion with a frequency $f$. The frequency with which its kinetic energy oscillates is
$A$ particle of mass $m$ performs $SHM$ along a straight line with frequency $f$ and amplitude $A.$
Medium
View SolutionThe variations of kinetic energy $K(x)$,potential energy $U(x)$,and total energy $E$ as a function of displacement $x$ of a particle in $SHM$ are as shown in the figure. The value of $|x_0|$ is
MediumKCET 2025
View SolutionThe displacement between the position of maximum potential energy and the position of maximum kinetic energy for a particle executing $S.H.M.$ is
Vedclass Products
For Students
Vedclass Test Series
Mock tests in real JEE/NEET style with performance analysis. 5-day free trial.
Start Free TrialFor Teachers
Exam Paper Generator
Generate Set A/B/C/D exam papers from 7.5L+ questions in 2 minutes. 3 chapters free.
Try FreeFor Institutes
Online Exam Module
Live online exams with unlimited students, 360° analytics & white-label branding.
See Demo