
Which of the following graphs correctly represents the plots of $K_{H}$ for gases in water versus temperature?
- A
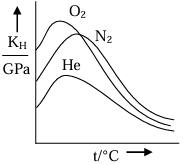
- B
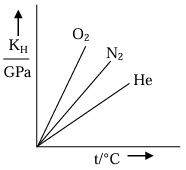
- C
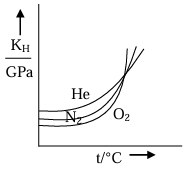
- D
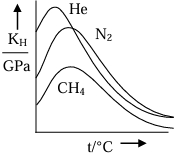
Explore More
Similar Questions
The solubility of $N_2$ gas in water at $25 \text{ }^\circ\text{C}$ and $1 \text{ bar}$ is $6.85 \times 10^{-4} \text{ mol L}^{-1}$. Calculate the solubility of $N_2$ gas in water at the same temperature when the partial pressure of $N_2$ is $0.70 \text{ bar}$.
DifficultMHT CET 2026
View SolutionCalculate the quantity of $CO_2$ required to prepare $1 \,L$ of soda water when the soda water is packed under $2 \,atm$ of $CO_2$. [Henry's law constant for $CO_2$ is $1.67 \times 10^8 \,Pa$] (in $\,g$)
What happens when a saturated solution of sugar is heated?
Medium
View SolutionWhy is a mixture of $He-O_2$ used by deep-sea divers instead of a $N_2-O_2$ mixture?
Easy
View SolutionAssertion : The molecules of the dissolved gas present in a liquid gain kinetic energy as temperature is raised.
Reason : Gases tend to be more soluble in liquids as the temperature is raised.
Reason : Gases tend to be more soluble in liquids as the temperature is raised.
MediumAIIMS 2009
View SolutionVedclass Products
For Students
Vedclass Test Series
Mock tests in real JEE/NEET style with performance analysis. 5-day free trial.
Start Free TrialFor Teachers
Exam Paper Generator
Generate Set A/B/C/D exam papers from 7.5L+ questions in 2 minutes. 3 chapters free.
Try FreeFor Institutes
Online Exam Module
Live online exams with unlimited students, 360° analytics & white-label branding.
See Demo