
Which one of the following schematic graphs best represents the variation of $p V$ (in Joules) versus $T$ (in Kelvin) of one mole of an ideal gas? (The dotted line represents $p V=T$)
- A
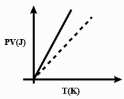
- B
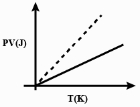
- C
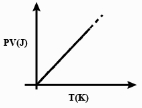
- D
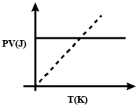
Explore More
Similar Questions
$A$ thermally insulated vessel contains an ideal gas of molecular mass $M$ and ratio of specific heats $\gamma$. It is moving with speed $v$ and it is suddenly brought to rest. Assuming no heat is lost to the surroundings,its temperature increases by
MediumAIEEE 2011
View SolutionThe r.m.s. velocity of hydrogen at $S.T.P.$ is $u \ m/s$. If the gas is heated at constant pressure until its volume becomes three times,then the final temperature of the gas and the r.m.s. speed are respectively:
$A$ fixed mass of gas at constant pressure occupies a volume $V$. The gas undergoes a rise in temperature so that the r.m.s. velocity of the molecules is doubled. The new volume will be
An ideal gas of molar mass $M$ is contained in a vertical tube of height $H$,closed at both ends. The tube is accelerating vertically upwards with acceleration $g$. Then,the ratio of pressure at the bottom $(P_B)$ and the midpoint $(P_m)$ of the tube will be:
An ideal gas $(\gamma = 1.5)$ is expanded adiabatically. To reduce the root mean square velocity of the molecules by a factor of $2$,the gas should be expanded by how many times?
DifficultMHT CET 2024
View SolutionVedclass Products
For Students
Vedclass Test Series
Mock tests in real JEE/NEET style with performance analysis. 5-day free trial.
Start Free TrialFor Teachers
Exam Paper Generator
Generate Set A/B/C/D exam papers from 7.5L+ questions in 2 minutes. 3 chapters free.
Try FreeFor Institutes
Online Exam Module
Live online exams with unlimited students, 360° analytics & white-label branding.
See Demo