
$A$ cylindrical resistor is connected across a battery $\varepsilon$. The cylinder has a uniform free electron density, and the middle part of the cylinder has a larger radius as shown in the figure. Which of the following graphs represents the variation of $V_d$ (drift velocity) with respect to $x$ (distance along the length of the resistor)?
- A
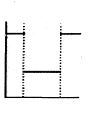
- B
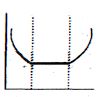
- C

- D
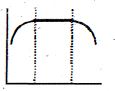
Explore More
Similar Questions
Derive the relation between electric current and drift velocity.
Easy
View SolutionThe electric intensity $E$,current density $j$,and specific resistance $\rho$ (often denoted as $k$ in some texts) are related to each other by the relation:
Easy
View Solution$A$ wire has a non-uniform cross-section as shown in the figure. $A$ steady current flows through it. The drift speed of electrons at points $P$ and $Q$ is $v_P$ and $v_Q$ respectively.
Medium
View SolutionThe area of cross-section of a copper wire is $4 \times 10^{-7} \,m^2$ and the number of free electrons per cubic metre in copper is $8 \times 10^{28}$. If the wire carries a current of $6.4 \,A$,then the drift velocity of the electrons (in $10^{-3} \,m \,s^{-1}$) is:
The lengths of two wires made of the same material are in the ratio $2:3$ and their radii are in the ratio $1:2$. If the two wires are connected in parallel to a battery,then the ratio of the drift velocities of free electrons in the two wires is
Vedclass Products
For Students
Vedclass Test Series
Mock tests in real JEE/NEET style with performance analysis. 5-day free trial.
Start Free TrialFor Teachers
Exam Paper Generator
Generate Set A/B/C/D exam papers from 7.5L+ questions in 2 minutes. 3 chapters free.
Try FreeFor Institutes
Online Exam Module
Live online exams with unlimited students, 360° analytics & white-label branding.
See Demo