
Medium
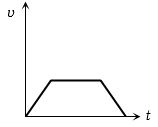
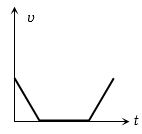
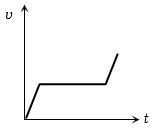
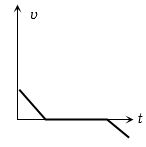
The acceleration-time graph of a body is shown. The corresponding velocity-time graph of the same body is
- A
- B
- C
- D
Explore More
Similar Questions
The displacement of a particle starting from rest (at $t = 0$) is given by $s = 6t^2 - t^3$. The time in seconds at which the particle will attain zero velocity again,is ..... $s$.
Easy
View SolutionFor the displacement-time graph shown in the figure,the ratio of the magnitudes of the (constant) speeds during the first two seconds and the next four seconds is
Medium
View SolutionTwo trains, which are moving along different tracks in opposite directions, are put on the same track by mistake. On noticing the mistake, when the trains are $300 \, m$ apart, the drivers start slowing down the trains. The graphs given below show the decrease in their velocities as a function of time. The separation between the trains when both have stopped is: (in $ \, m$)
DifficultAP EAMCET 2016
View Solution$A$ particle of mass $m$ is constrained to move on the $x$-axis. $A$ force $F$ acts on the particle. $F$ always points toward the position labeled $E$. For example,when the particle is to the left of $E$,$F$ points to the right. The magnitude of $F$ is constant except at point $E$ where it is zero. The system is horizontal. $F$ is the net force acting on the particle. The particle is displaced a distance $A$ towards the left from the equilibrium position $E$ and released from rest at $t=0$. The velocity-time graph of the particle is:
Match Column-$I$ with Column-$II$:
Vedclass Products
For Students
Vedclass Test Series
Mock tests in real JEE/NEET style with performance analysis. 5-day free trial.
Start Free TrialFor Teachers
Exam Paper Generator
Generate Set A/B/C/D exam papers from 7.5L+ questions in 2 minutes. 3 chapters free.
Try FreeFor Institutes
Online Exam Module
Live online exams with unlimited students, 360° analytics & white-label branding.
See Demo