
The current through a coil varies according to the following graph. Plot the graph for induced $emf$ $(e)$ versus time $(t)$ for the coil.
- A
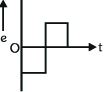
- B
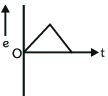
- C
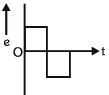
- D
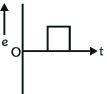
Explore More
Similar Questions
When a coil is placed in a time-dependent magnetic field, the power dissipated in it is $P$. The number of turns, area of the coil, and radius of the coil wire are $N, A$, and $r$ respectively. For a second coil, the number of turns, area, and radius are $2N, 2A$, and $3r$ respectively. When the first coil is replaced with the second coil, the power dissipated in it is $\alpha P$. The value of $\alpha$ is . . . . . . .
DifficultJEE MAIN 2026
View SolutionAs per the given figure,if $\frac{ dI }{ dt } = -1 \text{ A/s}$,then the value of $V_{AB}$ at this instant will be $.......... \text{ V}$.
What length of wire is required to construct a solenoid of length $l_0$ and inductance $L$?
Medium
View SolutionThe figure shows a part of a complete circuit. The potential difference $V_B - V_A$ when the current $I$ is $5 \ A$ and is decreasing at a rate of $10^3 \ A \ s^{-1}$ is given by ........ $V$.
Difficult
View SolutionThe current $i$ in an induction coil varies with time $t$ according to the graph shown. Which of the following graphs shows the induced $emf$ $(e)$ in the coil with time?
Medium
View SolutionVedclass Products
For Students
Vedclass Test Series
Mock tests in real JEE/NEET style with performance analysis. 5-day free trial.
Start Free TrialFor Teachers
Exam Paper Generator
Generate Set A/B/C/D exam papers from 7.5L+ questions in 2 minutes. 3 chapters free.
Try FreeFor Institutes
Online Exam Module
Live online exams with unlimited students, 360° analytics & white-label branding.
See Demo