
Class 12PhysicsDual Nature of Radiation and matterEinstein's Photoelectric Equation and Energy Quantum of Radiation
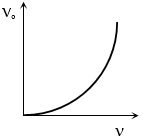
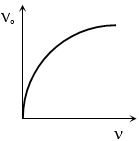
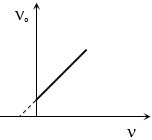
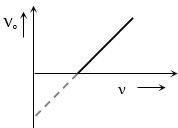
EasyFor a photoelectric cell,the graph showing the variation of stopping potential $(V_o)$ with frequency $(\nu)$ of incident light is best represented by:
- A
- B
- C
- D
Explore More
Similar Questions
By the photoelectric effect,Einstein proved:
The difference between threshold wavelengths for two metal surfaces $A$ and $B$ having work functions $\phi_A = 9 \, eV$ and $\phi_B = 4.5 \, eV$ in $nm$ is: (Given,$hc = 1242 \, eV \, nm$)
The work functions of three metals $A, B$ and $C$ are $W_A, W_B$ and $W_C$ respectively. They are in decreasing order $(W_A > W_B > W_C)$. The correct graph between the maximum kinetic energy $E_k$ of the emitted electron and the frequency $v$ of the incident radiation is:
Medium
View Solution$A$ beam of light of wavelength $\lambda$ falls on a metal having work function $\phi$ placed in a magnetic field $B$. The most energetic electrons, moving perpendicular to the field, are bent in circular arcs of radius $R$. If the experiment is performed for different values of $\lambda$, then the $B^2$ vs. $\frac{1}{\lambda}$ graph will look like (keeping all other quantities constant):
DifficultWBJEE 2024
View SolutionThe correct graph between the maximum kinetic energy $(K_{\max})$ of a photoelectron and the inverse of the wavelength $(1/\lambda)$ of the incident radiation is given by the curve:
Easy
View SolutionVedclass Products
For Students
Vedclass Test Series
Mock tests in real JEE/NEET style with performance analysis. 5-day free trial.
Start Free TrialFor Teachers
Exam Paper Generator
Generate Set A/B/C/D exam papers from 7.5L+ questions in 2 minutes. 3 chapters free.
Try FreeFor Institutes
Online Exam Module
Live online exams with unlimited students, 360° analytics & white-label branding.
See Demo