
Class 11PhysicsKinetic Theory of GasesGas Laws (Charles, Boyle's, Avagadro's, Gay Lussacs and Dalton's law) and Ideal gas Equation
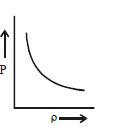
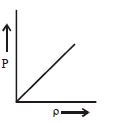
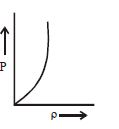
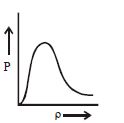
MediumThe correct graph between pressure $(P)$ and density $(\rho)$ of a gas at constant temperature is
- A
- B
- C
- D
Explore More
Similar Questions
For a given mass of a gas at constant temperature, the volume and the pressure are $V$ and $P$ respectively. Then the slope of the graph drawn between $\log_e V$ on the $X$-axis and $\log_e P$ on the $Y$-axis is
Consider a $1 \, cm^3$ sample of air at absolute temperature $T_0$ at sea level and another $1 \, cm^3$ sample of air at a height where the pressure is one-third atmosphere. The absolute temperature $T$ of the sample at that height is
Easy
View SolutionThe adjoining figure shows graphs of pressure and volume of a gas at two temperatures $T_1$ and $T_2$. Which of the following is correct?
Medium
View SolutionPressure of a gas of constant volume at $20^{\circ} C$ is $90 \ cm$ of $Hg$. At what temperature the pressure would change to $75 \ cm$ of $Hg$ (in $^{\circ} C$)?
$A$ pressure $P-$absolute temperature $T$ diagram was obtained when a given mass of gas was heated. During the heating process from state $1$ to state $2$,the volume:
Difficult
View SolutionVedclass Products
For Students
Vedclass Test Series
Mock tests in real JEE/NEET style with performance analysis. 5-day free trial.
Start Free TrialFor Teachers
Exam Paper Generator
Generate Set A/B/C/D exam papers from 7.5L+ questions in 2 minutes. 3 chapters free.
Try FreeFor Institutes
Online Exam Module
Live online exams with unlimited students, 360° analytics & white-label branding.
See Demo