
Class 12PhysicsElectric Potential and CapacitanceRelation between Electric Field and Potential and Potential Gradient
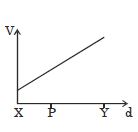
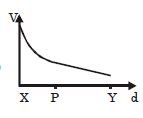
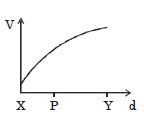
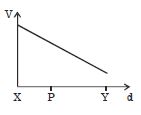
MediumThe diagram below shows electric field lines in a region of space. Which of the following diagrams best shows the variation with distance $d$ of the potential $V$ along the line $XY$ as we move from $X$ to $Y$?
- A
- B
- C
- D
Explore More
Similar Questions
In a certain region,the electric potential is given by $V = 6x - 8xy^2 - 8y + 6yz - 4z^2 \, V$. The magnitude of the force on a charge of $2 \, C$ at the origin is ........ $N$.
Difficult
View SolutionThe figure shows the variation of electric field intensity $E$ versus distance $x$. What is the potential difference between the points at $x = 2 \, m$ and $x = 6 \, m$ from $O$ (in $V$)?
Medium
View SolutionElectric field at a point $(x, y, z)$ is represented by $\vec E = 2x\hat i + y^2\hat j$. If the potential at $(0, 0, 0)$ is $2 \, V$,find the potential at $(1, 1, 1)$. (in $/3$)
Medium
View SolutionThe electric potential $V$ is given as a function of distance $x$ (metre) by $V = (4x^2 + 8x - 3) \ V$. The value of the electric field at $x = 0.5 \ m$,in $V/m$,is:
The electric potential is given by $V = 6x - 8xy^2 - 8y + 6yz - 4z^2$. Find the electric force in $N$ acting on a point charge of $2 \ C$ placed at the origin.
Difficult
View SolutionVedclass Products
For Students
Vedclass Test Series
Mock tests in real JEE/NEET style with performance analysis. 5-day free trial.
Start Free TrialFor Teachers
Exam Paper Generator
Generate Set A/B/C/D exam papers from 7.5L+ questions in 2 minutes. 3 chapters free.
Try FreeFor Institutes
Online Exam Module
Live online exams with unlimited students, 360° analytics & white-label branding.
See Demo