
Difficult
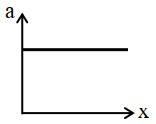
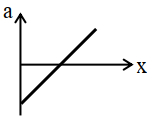
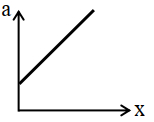
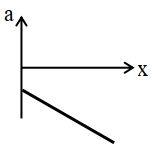
The velocity $(v)$ - distance $(x)$ graph is shown in the figure. Which graph represents the acceleration $(a)$ versus distance $(x)$ variation of this system?
- A
- B
- C
- D
Explore More
Similar Questions
If the position-time graph of a moving object is a straight line,determine the acceleration and velocity at any point.
Medium
View SolutionThe velocity-time graph for a car is a semicircle as shown in the figure. Which of the following statements is correct?
Medium
View SolutionThe velocity-time graph of a body moving in a straight line is shown in the figure. The ratio of displacement to distance travelled by the body in time $0$ to $10 \text{ s}$ is
DifficultMHT CET 2026
View SolutionRefer to the graph in figure. Match the following:
Graph Characteristics $(A)$ $(i)$ has $v > 0$ and $a < 0$ throughout $(B)$ $(ii)$ has $x > 0$ throughout and has a point with $v = 0$ and a point with $a = 0$ $(C)$ $(iii)$ has a point with zero displacement for $t > 0$ $(D)$ $(iv)$ has $v < 0$ and $a > 0$
| Graph | Characteristics |
| $(A)$ | $(i)$ has $v > 0$ and $a < 0$ throughout |
| $(B)$ | $(ii)$ has $x > 0$ throughout and has a point with $v = 0$ and a point with $a = 0$ |
| $(C)$ | $(iii)$ has a point with zero displacement for $t > 0$ |
| $(D)$ | $(iv)$ has $v < 0$ and $a > 0$ |
Medium
View SolutionThe velocity-time graph of an object moving along a straight line is shown in the figure. What is the distance (in $m$) covered by the object between $t = 0$ and $t = 4 \; s$?
Vedclass Products
For Students
Vedclass Test Series
Mock tests in real JEE/NEET style with performance analysis. 5-day free trial.
Start Free TrialFor Teachers
Exam Paper Generator
Generate Set A/B/C/D exam papers from 7.5L+ questions in 2 minutes. 3 chapters free.
Try FreeFor Institutes
Online Exam Module
Live online exams with unlimited students, 360° analytics & white-label branding.
See Demo