
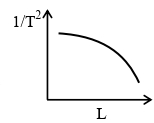
Using a simple pendulum experiment, $g$ is determined by measuring its time period $T$. Which of the following plots represents the correct relation between the pendulum length $L$ and time period $T$?
- A
- B
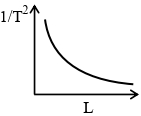
- C
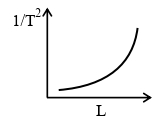
- D
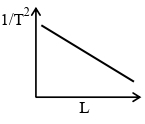
Explore More
Similar Questions
$A$ lift is descending with an acceleration of $g/3$. What will be the time period of a simple pendulum suspended from its ceiling if its time period in a stationary lift is $T$?
Medium
View SolutionThe time period of a simple pendulum is $2 \, sec$. If its length is increased $4$ times,then its period becomes ..... $\sec$.
What happens to the time period of a simple pendulum when it is taken to the moon's surface from the earth's surface?
Easy
View SolutionWhat is the frequency of oscillation of a pendulum suspended in a freely falling lift?
Easy
View Solution$A$ simple pendulum hangs from the ceiling of a car. If the car accelerates with a uniform acceleration,the frequency of the simple pendulum will
Easy
View SolutionVedclass Products
For Students
Vedclass Test Series
Mock tests in real JEE/NEET style with performance analysis. 5-day free trial.
Start Free TrialFor Teachers
Exam Paper Generator
Generate Set A/B/C/D exam papers from 7.5L+ questions in 2 minutes. 3 chapters free.
Try FreeFor Institutes
Online Exam Module
Live online exams with unlimited students, 360° analytics & white-label branding.
See Demo